Show Graph by Tensorboard
TBGraphWriter
-
class
nnabla.experimental.tb_graph_writer.TBGraphWriter(log_dir='log_out', comment='', **kwargs)[source]¶ - This class is a wrapper of tensorboardX summary writer,
which enable nn.Variable can be visualized as a graph by tensorboard.
- Prerequisite:
Install tensorflow and tensorboardX, simply by the following commands:
pip install tensorflow
pip install tensorboardX
Please refer to the following example to use this class:
Example:
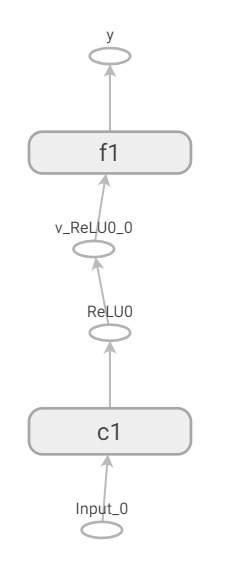
import numpy as np
import nnabla as nn
import nnabla.functions as F
import nnabla.parametric_functions as PF

def show_a_graph():
    try:
        from nnabla.experimental.tb_graph_writer import TBGraphWriter
    except Exception as e:
        print("please install tensorflow and tensorboardX at first.")
        raise e

    nn.clear_parameters()
    x = nn.Variable((2, 3, 4, 4))
    with nn.parameter_scope('c1'):
        h = PF.convolution(x, 8, (3, 3), pad=(1, 1))
        h = F.relu(PF.batch_normalization(h))
    with nn.parameter_scope('f1'):
        y = PF.affine(h, 10)

    with TBGraphWriter(log_dir='log_out') as tb:
        tb.from_variable(y, output_name="y")
The corresponding graph can be visualized as the following:
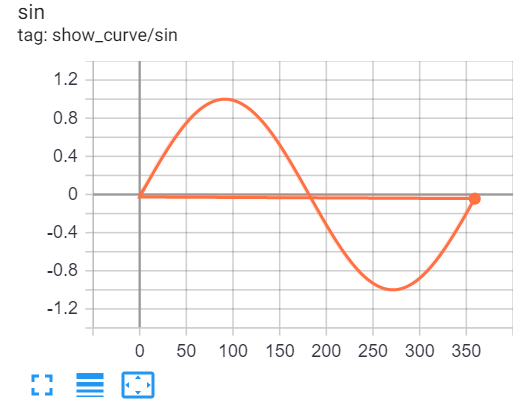
Or, you may show scalar value or histogram of values along the increasing of iteration number as the following:
with TBGraphWriter(log_dir='log_out') as tb:
    values = []
    for i in range(360):
        s = np.sin(i / 180.0 * np.pi)
        tb.add_scalar("show_curve/sin", s, i)
        values.append(s)

    nd_values = np.array(values)
    for i in range(10):
        tb.add_histogram("histogram", nd_values, i)
        nd_values += 0.05
It looks like:
- d

This class writes a protobuf file to
log_dirspecified folder, thus, user should launch tensorboard to specify this folder:tensorboard --logdir=log_out
- Then, user may check graph in a web browser, by typing the address:
- See Also:
https://tensorboardx.readthedocs.io/en/latest/tensorboard.html